Below is a description of the differences between the main elements of Power BI:
Dashboard
A dashboard in Power BI is an interactive dashboard that displays key visualizations (called "tiles") from one or more reports. It gives you a quick overview of important metrics and is optimized for real-time tracking. Users can't directly edit visualizations on the dashboard – it serves more as a showcase of data and individual visuals can be pinned to this dashboard using a pin.
Report
A report is a collection of one or more pages with different visualizations that are based on a single data model. It enables deeper data analysis, interactive filtering, and exploration. Unlike a dashboard, the report is more analytical and detailed, suitable for working with specific data.
App
A Power BI app is a package that can contain one or more reports and dashboards. It is intended for distributing content to end users in an organization. The application allows easy sharing and management of access rights, and is often used to publish ready-made solutions for a specific department or team.
Report Layout
In Power BI, there are two main options for the layout of the report according to the device on which the report will be displayed: Desktop Layout and Phone Layout (Mobile Layout). Each of them has its own specific characteristics and purpose:
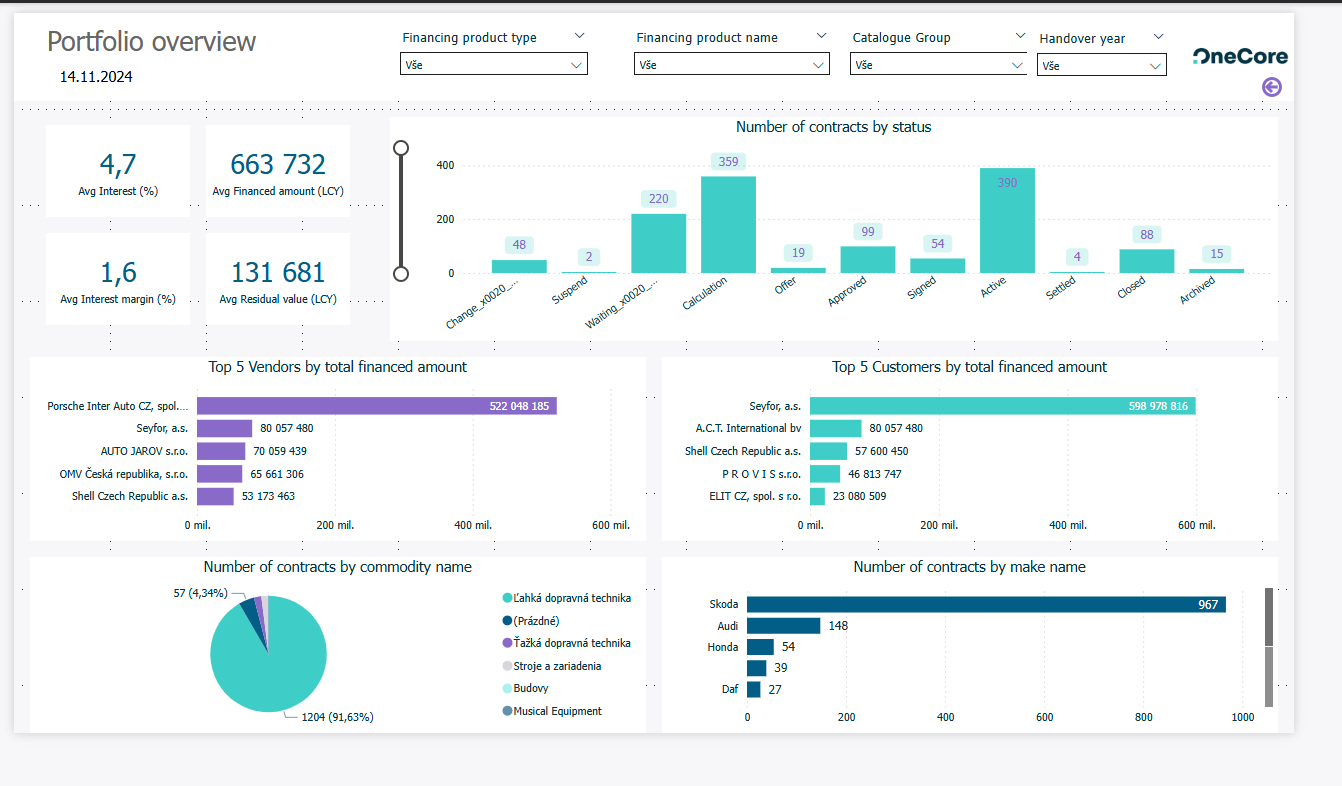
Desktop layout
Description:
This is the default layout that is used when designing a report in Power BI Desktop or the web editor. It's optimized for larger screens, allowing you to place multiple visualizations side-by-side, use more space, and work with complex interactions.
Possibilities:
-
Multi-column arrangement of visualizations.
-
Use the entire space of the page.
-
Interactive filters, slicers and navigation.
-
Possibility to move between report pages.
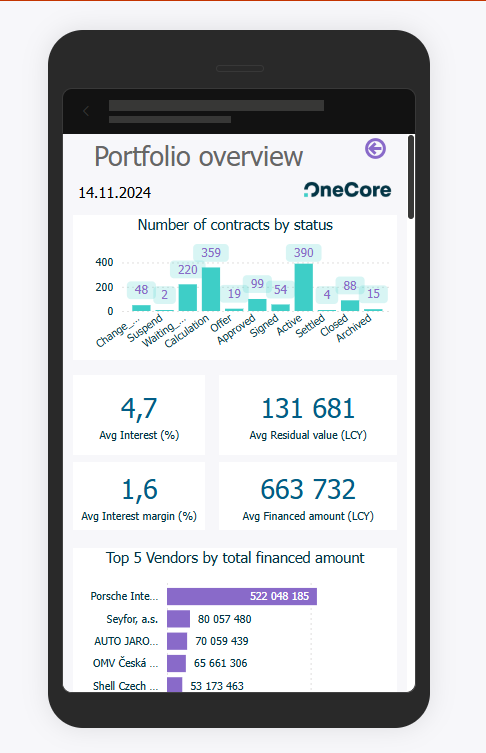
Phone layout (Mobile layout)
Description:
This layout is intended for viewing the report on mobile devices. In Power BI, you can create a special mobile version of each report page, where visualizations are rearranged in a vertical format suitable for smaller screens.
Possibilities:
-
Drag and drop visualizations onto the mobile canvas.
-
Optimization of the size and order of elements.
-
Simple, clear view for quick access to data.
-
Automatically switch to mobile layout when you open a report in the Power BI mobile app.